Network Security · Beginner
Packet Capture Gaps · Did the Network Drop It or Did the Sensor Miss It?
Use paired TCP captures, acknowledgments and sensor counters to tell a coverage gap from possible network loss.
Updated 2026-11-20
On this page
Learning goal. Explain where a packet could disappear, read a TCP acknowledgment against the capture, and state which evidence you still need before calling an outage or closing an investigation.
1. Follow the live packet and its copy
The production path connects the client to the server. The capture path carries a copy of some or all of that traffic to an observer. A network TAP provides a copy at a point on a link. A switch SPAN or mirror session copies configured ports or VLANs and directions to a monitoring destination. Two sensors can see different packets simply because their observation points differ.
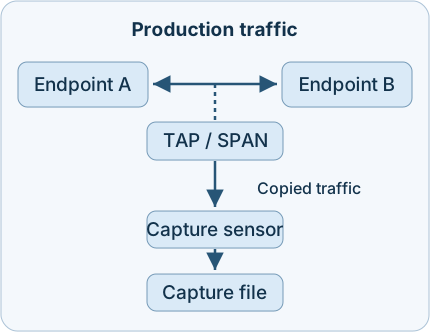
The dashed branch marks the observation point. After the copy reaches the sensor, its NIC and capture buffers feed an application that writes packets to a PCAP or parses them into events. A capture filter selects what is recorded. A display filter selects what the analyst sees when opening the recording. Snaplen limits the bytes retained per captured packet. A short snaplen can preserve headers and cut payload while the packet record remains present. The original and captured lengths help distinguish trimming from a missing record.
| Where the gap appears | Evidence to check | What that supports |
|---|---|---|
| On the production route | Two captures bracketing the suspected segment, endpoint TCP counters or device drop counters | Whether a transmission failed to arrive at the next verified observation point |
| On the copy path | Mirror direction and VLAN list, destination congestion or discard counters, second observation point | Whether traffic could reach the endpoints while the sensor lost coverage |
| At the capture host or writer | NIC/driver and live capture-buffer counters, file time range, snaplen, filters | Which part of recording could have lost or trimmed the evidence |
| After capture | Raw PCAP against parsed or indexed events, pipeline and parser health | Whether records exist upstream but fail to reach the analyst |
2. Read TCP numbers before reading the label
SEQ identifies the first byte carried by a data segment. ACK normally tells the sender the next byte the receiving TCP stack expects. ACK is cumulative for bytes in sequence. If the server sends ACK 1081 in an ordinary connection, it reports receipt of contiguous data through byte 1080. The TCP stack can report this before the application consumes the bytes.
In a normal upload, the client sends 40 bytes starting at SEQ 1001 and the server returns ACK 1041. The client sends 40 more starting at SEQ 1041 and the server responds with ACK 1081. The two byte intervals are 1001–1040 and 1041–1080. In a copy that contains the first interval and both ACKs but omits the second interval, ACK 1081 is evidence that the receiver reported bytes the file cannot show. Given the complete reference copy in the exercise, the difference is in the recording. In the field, check the direction, capture start, observation point and handling of the stream before assigning a cause.
| Observation | First question | Useful next evidence |
|---|---|---|
| ACK advances beyond recorded data | Did the capture start late or miss a direction or copy of the bytes? | Capture scope and a receiver-side or second capture |
| Later SEQ jumps over a range | Do the missing bytes arrive later, or was only their copy missed? | Sequence ranges, timestamps and reverse-direction ACKs |
| Retransmission or duplicate ACKs | Can you establish the original send, later send and reception? | Both endpoint views, counters and a comparable time range |
Wireshark’s TCP analysis uses the recorded packet order and the TCP sequence analysis preference. A retransmission label is a heuristic. An ACK can cover more than one segment, and its value does not establish which transmission arrived. A proxy or TCP-terminating load balancer creates separate connections. Compare evidence within the same leg first. If NAT changes addresses or ports, reconcile the tuples with a translation record before joining captures.
3. Recognize blind spots and misleading signals
A mirror with multiple busy source ports can offer more traffic than its destination can carry. One-sided observation can also occur when forward and reverse traffic take different paths. At an endpoint, NIC offload can make packet sizes or checksums look different from a wire capture. A PCAP export may start after the handshake or cover only part of a session. A timestamp can be wrong or frames can be reordered during collection. Check these explanations before attributing a flagged gap to service failure.
Traffic bursts, including abusive floods, can overload a monitoring pipeline and lower confidence in alerts during the same period. Investigate health and traffic volume together. Compare rates against a known baseline and corroborate with switch, firewall and service records to distinguish busy legitimate traffic from abuse. An empty alert list during degraded coverage gives limited evidence about what traversed the segment.
4. Collect, detect and respond
- Fix the scope. Record UTC times, clock offset if known, capture point, interface, direction, VLAN, TCP tuple, capture and display filters, snaplen, and sensor/backend versions. Preserve originals and capture metadata. Make a scoped analyst copy separately.
- Read sensor health over the same window. In Zeek deployments with the capture-loss policy loaded, group
capture_loss.logbypeerand usetsandts_deltato align windows. Readgaps,acks, andpercent_losttogether. In Zeek 9.0.1 LTS a measurement with 24 gaps and 1,200 ACKs is 2% on this ACK-based metric. Compare like peers and demand enough ACKs for meaningful comparisons. A missing row, a low-volume window, or UDP visibility needs other coverage evidence. A higher result cannot locate loss by itself. - Compare counters at adjacent layers. With libpcap live capture,
ps_dropcovers OS capture-buffer drops where supported, andps_ifdropis an interface/driver counter where supported. Use two readings in the same capture instance, check resets and support, and retain the interval. A zero value can mean the counter is unavailable. These live API statistics cannot be recovered by reopening an ordinary saved PCAP. Switch mirror counters and NIC statistics are separate observations. If only indexed records disappear, check the parsing and delivery path before blaming capture. - Classify and respond. Mark affected sensors, directions and times on the investigation. Compare an independent observation point and service logs. For possible production loss, ask network and service owners to check interfaces and endpoint counters on the affected path. For degraded collection, work with the sensor owner on mirror scope or capacity and confirm improvement with an authorised, harmless test exchange observed at both points. Preserve the original gap and its impact in the incident timeline.
5. Offline exercise · Compare two PCAPs
Download the complete trace and the trace with a gap. These are generated Ethernet/IPv4/TCP fixtures with documentation-only addresses and placeholder payload. No network session was generated or captured. Open each file separately in Wireshark with Analyze TCP sequence numbers enabled. Only a local copy of the files is needed. This exercise does not require a live adapter or a target.
Use the tcp display filter first. Expand the TCP header and use Sequence Number (raw) and Acknowledgment Number (raw) to match the following numbers. With relative numbering enabled, the server’s final ACK is displayed as 81 because the client’s initial sequence number is 1000.
| Evidence | Complete trace | Trace with a gap |
|---|---|---|
| Opening SYN, SYN/ACK, ACK | Frames 1–3 | Frames 1–3 |
| First client payload and server ACK | Frame 4 SEQ 1001, Len 40. Frame 5 ACK 1041 | Same raw values and frame numbers |
| Second client payload | Frame 6 SEQ 1041, Len 40 | Absent |
| Last server ACK | Frame 7 ACK 1081 | Frame 6 ACK 1081 |
Next try tcp.analysis.ack_lost_segment to isolate the heuristic for an ACK covering unseen data. For other captures, tcp.analysis.lost_segment highlights a jump in observed sender sequence. Start with the raw numbers and use these fields as shortcuts. If the results differ, clear the filter, confirm both directions are shown, verify the TCP analysis setting and file name, and make sure you are reading raw fields. The fixtures’ wire format, checksums and byte ranges were verified in the cloud with an independent parser. Wireshark’s analysis flags and Zeek behaviour here are based on documentation review.
6. Check your understanding
- The reverse ACK reaches 1081 and only bytes through 1040 are visible. Where did the gap occur? With the matched complete trace, it is a recording gap. With the short trace alone, you know what the ACK reports and what the file lacks. Check where and when the file was collected before localising the gap.
- A live capture reports zero
ps_ifdrop. Is sensor visibility complete? Verify counter support and repeat the measure at the mirror, host and recording layers. Zero is specific to the reported counter and window. - A Zeek peer reports 2%
percent_lost, while application requests succeed. Is 2% of its UDP traffic lost? The reported metric is derived from TCP ACKs. Use relevant evidence for UDP and separate service health from observation quality.
Completion. Write two sentences for the paired files. State which sequence range is missing and what the receiver ACK reports. Then name one additional observation you would request if you only had the incomplete file.
Previous · TCP connections and packet evidence · Next · Network monitoring and triage
Official references
Reviewed 20 November 2026. Check installed versions and capture backend before interpreting production counters.
- IETF RFC 9293 · TCP sequence numbers and acknowledgment, August 2022
- Wireshark User’s Guide · TCP analysis and TCP display filter reference · the two analysis fields through 4.6.10
- Zeek 9.0.1 LTS · capture-loss policy and log fields
- The Tcpdump Group · libpcap pcap_stats manual, live counter semantics and platform differences
Related articles
Certificate Transparency · Verify Log Evidence and Investigate Unexpected Issuance
Distinguish a certificate log entry from an SCT, a proof of inclusion and a certificate served by an HTTPS endpoint.
Certificate Validation: Trust Chains, SAN, EKU, Expiry and an Offline PKI Lab
Build and validate a disposable root–intermediate–leaf chain; distinguish trust, service identity, purpose, time and revocation evidence with six controlled tests.