DFIR · Beginner
Incident Timelines · UTC, Clock Skew and Log Arrival
Normalize multi-source log timestamps and use uncertainty ranges in an offline incident timeline.
Updated 2026-11-20
On this page
Learning goal. Identify the time represented by a firewall, proxy or host record. Preserve the original timestamp, convert it to UTC, apply measured clock error and decide which observations can be placed in order.
1. A timeline takes more than sorting timestamps
Suppose a firewall permit shows 00:00:05 and a proxy request starts at 00:00:10. Did a host record of 00:00:17 happen last? If the host clock was eight seconds ahead, its corrected estimate is 00:00:09. An observation can also reach the investigation system long after it occurred. Ignoring those differences can reverse apparent cause and effect or link unrelated sessions.
| Time | Meaning | Evidence to check |
|---|---|---|
| Original event time | Timestamp recorded by the source | Zone, format, clock and event stage |
| Log generation or receipt | When a record was emitted or received | Buffer, retry and forwarding lag |
| Index time | When the SIEM indexed the record | Processing delay or replay |
| Corrected estimate | Comparison time after measured clock correction | Calibration, validity window and uncertainty |
For example, Zeek conn.log ts represents the first observed packet of the connection. The record may reach a collector later. A proxy field can refer to request start or completion depending on its definition and configuration.
2. Convert to UTC, then correct for clock error
UTC provides a common clock reference for comparing records. In an RFC 3339 timestamp, Z means UTC and +09:30 denotes a display offset of nine hours and thirty minutes. Thus 09:30:05+09:30 becomes 00:00:05Z. Verify the unit before converting a Unix timestamp. Seconds, milliseconds and microseconds occur in different formats. Find the source configuration before assigning a zone to an offset-free value.
A separate calibration showing that the device was eight seconds ahead calls for subtracting eight seconds from its UTC timestamp. Here, a positive correction parameter means “clock ahead.” Check that the measurement still applies across reboots and time synchronization changes. Expand the uncertainty or leave the comparison unresolved when the calibration may no longer apply.
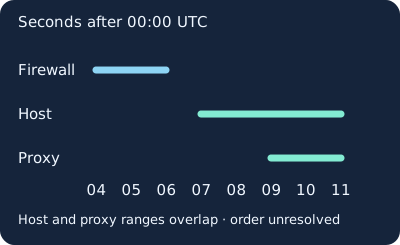
The firewall range is 00:00:04–06, the host range is 00:00:07–11 and the proxy range is 00:00:09–11. Under the worksheet assumptions, the firewall must precede the host because their ranges are disjoint. The host and proxy overlap despite centers at nine and ten seconds. Their order remains unresolved. Temporal precedence still needs independent evidence to establish causation.
3. Record provenance before correlating
- Preserve the source event, event ID, host and sensor, and original time string. Store normalized and corrected times as derived fields.
- Record device zone, clock synchronization, capture location and UTC range. Document the measurement method and validity period for each correction. Errors can also be shared by devices using the same reference.
- When two pipelines contain copies, compare producer, host, stable identifier and event content. Preserve conflicting originals. Events in the same second can represent separate observations.
- Verify which value the SIEM assigns as event time. Check missing source fields, fractional seconds, time zone conversion, replay and retention.
Splunk _time is the assigned event timestamp. _indextime records indexing. Their difference can include timestamp parsing or clock errors as well as delivery delay. For a known test, compare both with the raw value and the ingest settings. In the systemd journal, __REALTIME_TIMESTAMP is the journal’s wall-clock receipt time. _SOURCE_REALTIME_TIMESTAMP, where supplied, provides source timing evidence. Scope __MONOTONIC_TIMESTAMP to a boot.
4. Investigate unexpected timing and collection behavior
| Observation | Ordinary explanation | Next evidence |
|---|---|---|
| Three-minute-old records arrive together | Collector retries a buffer | Event and index times, collector status and another source |
| Host time suddenly jumps back | Reboot, synchronization or configuration change | Boot ID, time service logs and change authorization |
| One source stops after an alert | Expired retention, forwarding failure or changed route | Local and central records, logging service and audit policy |
| Several events share a source address | Shared NAT or scheduled workload | Translation mapping, session identifiers, host and process |
Delay or collection gaps during an incident can increase investigation priority. Compare independent sensors and change history. When evidence supports action, preserve originals and scope affected assets under local incident procedures. Record times before and after any authorized clock repair so later investigators can reconstruct the change.
5. Offline lab · Eight fictional records
time-correlation.json · time-correlation.py
Put both files in one folder and run Python 3. The synthetic JSON mixes RFC 3339, Unix seconds and a timestamp with no offset. clock_ahead_s and uncertainty_s contain fictional calibration values. The worksheet deduplicates by source, host, ID and matching content. In production, validate how identifiers are scoped and whether reuse is possible.
python3 time-correlation.py
| Record | Expected observation |
|---|---|
| f-01 / n-01 | Both become 00:00:05 UTC from an offset string and epoch seconds, respectively |
| h-01 | Subtract eight seconds from 00:00:17. Center is 00:00:09 and range is seconds 07–11 |
| p-01 | One duplicate ingestion. Time range overlaps h-01 |
| h-02 | Corrected to 00:00:27 and after p-01 |
| u-01 / h-03 | Zone or clock correction missing, so they stay out of the comparison |
Expect PASS: 8 records, 1 duplicate, 2 unplaced, 3 ordering checks. If a file is missing, verify both filenames and folder. If output differs, check units, correction sign and whether the intervals overlap. Publication executed the fictional analyzer. Verify Zeek, Splunk or journal collection separately in the deployed version and configuration.
In a system you own or have approval to test, send one ordinary request to a designated service. Record the time and response, then compare the request identifier and event times from network, service and collector records.
6. Check your understanding
- An event indexed late occurred late? Record event time and index time separately. Examine source clock, parsing and delivery.
- Host at nine seconds, proxy at ten. Is the host first? The uncertainty intervals overlap. Leave the order unresolved.
- Does a known order establish the events belong together? Find a request ID, NAT mapping, session or process lineage to support the connection.
Finish by writing the original and normalized values, correction grounds and time ranges for two records. Explain one supported order and one unresolved order.
Foundation · Splunk searches · Next · Windows incident response lab
Related lesson
Linux process investigation and PID reuse
Official references
Reviewed 20 November 2026. Apply protocol dates and product-specific field definitions to the installed version and configuration.
- IETF RFC 3339 · Internet date and time, 2002 · RFC 9557 · Extensions, 2024
- Zeek · conn.log current documentation
- systemd · Journal fields
- Splunk · Event and index time
- NIST SP 800-61 Rev. 3 · Incident response, April 2025
Preserving Digital Evidence · SHA-256 and Custody
Verify acquired logs and working copies in the evidence lab
Measure the Host Clock with NTP
Calculate offset from four timestamps and verify the selected time source
Related articles
Backup Restore Verification · From Saved Copy to Recoverable Service
Use a real offline SQLite restore exercise to distinguish a matching hash, a usable database, an acceptable recovery point, and a service ready to resume.
Velociraptor Endpoint Collection: From a Network Alert to Host Evidence
Scope a request to one endpoint and interpret collection coverage, zero results, missing files and SIEM delivery using nine fictional cases.