DFIR · Beginner
Linux Process Investigation: PID Reuse and Process Identity
Learn to compare Linux process lifetimes across boots and containers, then test eight synthetic observations and a benign procfs read.
Updated 2026-11-20
On this page
Learning goal. Determine whether two observations describe the same Linux process lifetime, explain how much a snapshot can prove, and recognize when a PID alone leaves a connection unresolved.
1. A PID is a number within a view
A process is a running instance that executes a program. The PID (process ID) is the number Linux uses to refer to it in a particular PID namespace. A PID namespace gives processes their own number space. A container process might appear as PID 7 inside a container and PID 4200 on the host. A second container can have its own PID 7. The PID can also be reused after a process exits, even without a reboot.
A process lifetime starts with creation and ends with exit. An execve operation replaces the program image in an existing process and retains its process ID. That is how a wrapper can hand off to a worker without creating another process. A parent PID describes a parent relationship as observed at a particular point. The parent can exit, the child can be reparented, and the old parent’s PID can be reused. A process name and a PID pair are leads for history, not a history by themselves.
| Field | Question it answers | What to verify |
|---|---|---|
| Host identity and boot ID | Which machine and which boot produced the record? | Use the origin inventory identity, not the collector name or hostname alone. Preserve the boot ID where available. |
| PID view and PID | In what number space is this number expressed? | Record the collector’s procfs or sensor view. Normalize host and container PIDs only with a verified mapping. |
| Process start ticks | When in that boot was this process started? | Read field 22, starttime, from /proc/<pid>/stat. Record the clock tick rate if converting units. |
| Current program and parent | What program image and parent are visible at sampling time? | These can change. Look for recorded execution and parent events for historical claims. |
procfs is the kernel’s virtual filesystem normally mounted at /proc. Its per-process files report what the kernel exposes at read time. Collecting them periodically creates snapshots, which can miss a process that both starts and exits between polls.
A tick here is a unit of process start time after boot. os.sysconf("SC_CLK_TCK") gives the rate on Linux. If it reports 100, 12,000 ticks are 120 seconds in that clock domain. This number is neither an epoch timestamp nor a count of CPU consumed. Keep the exact integer and confirm a common clock basis before comparing. On Linux kernels with time namespaces, procfs can apply a boot-time offset from the reader’s time namespace independently of the PID view. Compare within one time view or establish a supported mapping first. Keep UTC event and collection times separately. Journal monotonic reception timestamps and procfs start ticks serve different purposes and use different units; do not substitute one for the other.
2. Build a key before you build a story
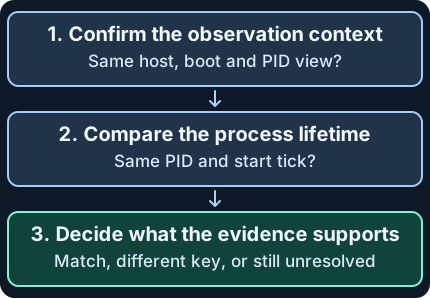
- Establish the originating host and boot. The kernel exposes a boot UUID at
/proc/sys/kernel/random/boot_idwhere visible. The journal stores_BOOT_IDas 32 hexadecimal characters. Preserve originals and use a consistent representation when comparing the UUID forms. - Establish the number space used by the source. The PID in a procfs path uses the view of that procfs instance.
/proc/<pid>/statuscan exposeNStgid(process ID across the visible namespace hierarchy) andNSpid(thread ID), on kernels supporting those fields. For the thread-group leader the identifiers agree in each namespace. Record the observed mapping while the task is alive. The target’s own namespace identifier alone does not say which view an event’s PID used. - Compare PID and start ticks within that scope and a common time view. Matching host, boot, PID view, PID and ticks is substantially stronger than matching PID alone. Ticks have finite resolution, and collectors can miss short lifetimes or normalize incorrectly. Use a documented process instance ID from the same sensor when available. Treat cross-sensor correlation as a separate check.
Normal example. A report scheduler launches a wrapper. At 09:00:02 UTC it is observed as PID 4200 with start tick 12000. At 09:00:04 the same view still has 4200 and 12000, but the observed image is Python. That fits a wrapper replacing itself. An execution event or a known test workflow can corroborate it. Later, a fresh observation has PID 4200 and start tick 40000 in the same host, boot and view. The different starting point supports a different lifetime. A historical security event without a start tick cannot be assigned to the latest PID 4200 simply because it is visible now.
3. Choose the evidence source for the question
| Source | What it can contribute | Collection requirement or limit |
|---|---|---|
A live /proc snapshot |
Current state, start tick, parent at sample time, namespace mapping and, if readable, executable link | Linux with a readable procfs view. Short-lived tasks may exit between reads. Access controls or mount options can hide entries. |
| systemd journal | Unit and message context, boot, PID, and available metadata for the message origin | Requires systemd-journald to have collected the relevant messages, a readable journal and sufficient retention. A forked process’s stdout/stderr stream can carry the original sender credentials. |
| Linux Audit or an endpoint sensor | Historical execution and supporting fields, or a product-defined process identifier | Kernel and collector coverage, matching rules and retention must predate the event. Verify what the fields mean and whether loss or filtering occurred. |
A PID filter is an investigation aid. For example, in a readable systemd journal, use the boot identifier you obtained from the source (32 hex characters) and a narrow UTC interval. Assign your approved values to BOOT_ID, FROM_UTC and TO_UTC before running:
journalctl --utc --since "$FROM_UTC" --until "$TO_UTC" \
  "_BOOT_ID=$BOOT_ID" "_PID=4200" --output=json --no-pager
Use a value such as 2030-02-03 09:00:00 UTC for the input format, replacing the fictional time and PID with your scope. This returns journal messages in that filter, including more than one lifetime if the PID was reused in the window. It does not return a complete process creation history. A missing result can mean messages were never sent to the journal, lacked matching fields, or expired. Run the lab below independently of systemd.
Suspicious versus ordinary. A misleading process name can make activity blend into a normal workload, and a PID-only join can wrongly assign a suspicious connection to a benign process. Start with the sensor’s recording scope, then corroborate executable provenance, the service or container, the execution chain, and network activity with an independent source. A name matching a service is weak evidence; a changed image can be expected after a wrapper handoff. An unobserved dependency or missing parent can also be a collection gap. For prevention and detection checks in an authorized environment, use a known benign process and verify that observations and scope survive ingestion.
During response, record the source and observation time, keep the raw fields, and note the confidence in each association. Collect command lines only when authorized and necessary; they can contain secrets. If a process needs isolation or termination, reconfirm its identity through the authorized tooling immediately before acting. Historical PID data alone is an unsafe target. Document which supporting evidence links the response to the intended workload.
4. Offline exercise and read-only Linux demonstration
Save the synthetic CSV and the Python reader to the same folder. The labels, executable paths and UTC times are fictional. Python 3 and its standard library are enough for the offline exercise:
python3 linux-process-evidence.py
The fixture assumes one comparable time basis for the observations. The script compares each row to p01. Its output judges the supplied keys. A different PID view prevents a direct match and can still describe the same underlying process if a trustworthy namespace translation is later established.
| Observation | Expected result against p01 | Reason |
|---|---|---|
| p02 | Same key | Program image changes while the process key agrees. |
| p03 | Different key | Start ticks differ in the same host, boot and PID view. |
| p04 | Different key | Container view uses a different PID number space. |
| p05 | Different key | Same values reappear in a new boot. |
| p06 | Unresolved | Start ticks were unavailable. |
| p07 | Different key | Originating host differs. |
| p08 | Different key | PID differs within the same host and view. |
Expected summary. One matching key, five different keys and one unresolved comparison. If the fixture does not load, check its name, CSV header and the first row’s identity fields. If the counts differ, compare the fields individually. The same tick in a scope can appear on multiple PIDs.
On a Linux system you own or have explicit permission to use, with readable procfs and matching PID views for Python and /proc, run the optional demonstration:
python3 linux-process-evidence.py --own-child
It starts a Python child that waits on a pipe, reads only that child’s stat twice, closes the pipe and waits for the child to exit. The code reads from one open proc directory, which will not retarget a different process if the number is reused. It parses stat after the closing parenthesis of comm; splitting the entire file on whitespace would miscount fields when a name contains spaces.
Expected live result. Both samples have identical start ticks. The open directory no longer yields stat after the child’s exit. If access is denied or the folder is missing, check the platform, mount policy and PID view in an authorized shell. A managed container may hide part of procfs. This demo requires no elevated privileges, performs no forced PID reuse, and does not enable audit rules. The published scripts were exercised against the synthetic CSV and a live self-owned child in the cloud. Product telemetry and journal querying were reviewed against documentation.
5. Check your understanding
- Same PID and same executable after a reboot. Same lifetime? No. The boot boundary separates the two observations.
- Different executable, same complete key. Does this prove malicious activity? An ordinary
execvecan change the program image. Corroborate the expected workflow and execution history. - Two containers both report PID 7. Can you join them directly? PID 7 is local to its view. Use a verified namespace mapping and lifetime evidence.
- A journal query returns no messages. Did the process run? The query result alone does not settle that. Verify the source’s coverage and look for historical execution evidence elsewhere.
You are done when you can explain the differences among p02, p03 and p06, explain why p04 needs a mapping to compare across views, and describe what the live exercise did and did not observe.
Previous · Linux SSH and sudo evidence · Next lesson · Incident timelines and clock uncertainty · Windows counterpart · Sysmon process identity
Official references
Reviewed November 20, 2026. Source versions below describe the documented coverage. Check the kernel, distribution and collector installed in your environment.
- Linux kernel online documentation at review. Procfs lifetime semantics, view/access controls, and boot UUID. The /proc filesystem · Kernel sysctls, random · Kernel implementation, fs/proc/array.c
- Linux man-pages 6.19. Field 22 units, namespace PID fields, and process image replacement. proc_pid_stat(5) · proc_pid_status(5) · pid_namespaces(7) · time_namespaces(7) · execve(2)
- systemd 262 online manual. Origin credentials, boot identifier and journal time fields. systemd.journal-fields
- RHEL 9 product family. Linux Audit delivery, rule-based coverage and example record fields. Red Hat Enterprise Linux 9 · Auditing the system
Verify Local and Central Linux Journal Coverage
Compare boot, namespace and cursor evidence to locate collection gaps.
Investigate Linux File Permissions
Apply process credentials to a file access decision.
Investigate Linux systemd timers
Investigate Linux systemd timers. Separate timer configuration, individual service runs, and application results.
Investigate Linux file activity
Linux Audit file evidence · Join system calls and paths, then test what a file-open record can establish.
Related articles
Backup Restore Verification · From Saved Copy to Recoverable Service
Use a real offline SQLite restore exercise to distinguish a matching hash, a usable database, an acceptable recovery point, and a service ready to resume.
Velociraptor Endpoint Collection: From a Network Alert to Host Evidence
Scope a request to one endpoint and interpret collection coverage, zero results, missing files and SIEM delivery using nine fictional cases.