Network Security · Beginner
Read Zeek conn.log: States, History, and Bytes
Interpret Zeek connection summaries, distinguish missing values from zero, and connect TCP and UDP evidence to HTTP and DNS logs.
Updated 2026-11-21
On this page
Start here after Network Monitoring or TCP Connections and Packet Evidence. You will read a connection summary, find the matching application records, and write a conclusion that fits what the sensor could see.
1. What does one row describe?
Zeek is a network monitor that creates structured logs from traffic it observes. In conn.log, one row summarizes a connection or flow as Zeek tracked it. A flow groups packets that belong to an exchange between endpoints. A connection summary can cover many application messages. An HTTP access log, by comparison, can record individual requests.
Originator (orig) and responder (resp) are Zeek’s directions for a flow. In an ordinary TCP handshake, the endpoint sending the opening SYN is the originator. Check the sense of these fields when traffic is partial or when history contains ^, which marks a direction flip. Neither direction label alone identifies the internal host, affected user, or responsible process.
| Read this field | What it tells you | What to check next |
|---|---|---|
ts |
Unix timestamp of the first packet Zeek observed for the flow | Convert to UTC. Keep sensor time, ingest time, and search bounds separate. |
id.orig_h, id.orig_p, id.resp_h, id.resp_p, proto |
Source and destination in Zeek’s direction convention, plus transport | Compare time and viewpoint if NAT, proxies, or port reuse are involved. |
uid |
Zeek’s connection ID | Join logs from the same dataset using the UID. Keep dataset provenance in a shared index. |
conn_state, history |
Lifecycle summary and compact observations by direction | Read both with the transport and compare raw packets when needed. |
service, duration |
Confirmed protocol information when available, and elapsed time measured by Zeek | A port is a hint. An unset service has several explanations. For TCP, duration can exclude trailing nonproductive packets. |
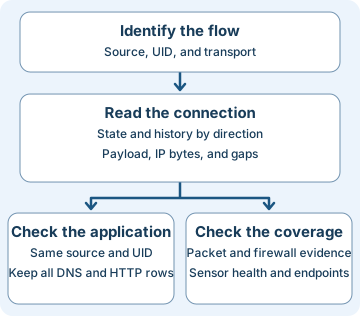
2. Read state, history, and counters together
| State and transport | First interpretation at this sensor | Useful next check |
|---|---|---|
S0 TCP |
Attempt observed, reply unobserved | Reverse-path visibility, firewall decision, listener |
REJ TCP |
Attempt rejected | With Sr, the sensor saw an originator SYN and a responder RST. Identify where the reset came from. |
SF TCP |
Zeek classified establishment and termination as normal | HTTP status, application or authentication result |
S1 TCP |
Established, termination unobserved | End of capture, logging timeouts, direction coverage |
RSTO / RSTR TCP |
An established connection was reset by the originator / responder respectively | Packet sequence and endpoint, proxy, or firewall logs |
OTH TCP |
Midstream traffic with no SYN observed | Capture start, asymmetric routing, mirror configuration |
SF UDP with Dd |
Payload observed in both directions in this UDP example | DNS transaction result if available |
Read uppercase as originator and lowercase as responder. In ShADadFf, S is the opening SYN, h is the responder’s SYN+ACK, and A is a pure ACK from the originator. D and d indicate data, F and f FIN. r indicates a responder reset and g a responder-side content gap. Some markers are recorded only once per direction. Repeated gap and retransmission markers use logarithmic thresholds. Use a packet capture to count packets or reconstruct packet order.
| Byte fields | Units and meaning | Interpretation limit |
|---|---|---|
orig_bytes / resp_bytes |
Transport payload bytes attributed to each direction. For TCP, Zeek derives these from sequence numbers. | Partial visibility and unusual sequence behavior can distort estimates. They cannot count HTTP body bytes or prove delivery to the application. |
orig_ip_bytes / resp_ip_bytes |
IP-layer byte totals when the connection-size analyzer supplies the fields | Includes IP and transport overhead as observed. Check packet and capture scope before comparing with other sensors. |
missed_bytes |
Bytes of content gaps recognized by Zeek | A positive value supports a content gap. Zero means Zeek recorded zero recognized gap bytes. Coverage, frame drops and traffic outside the capture still require checks. |
An omitted JSON property or null represents missing data according to writer and ingestion configuration. In native TSV, read the #unset_field and #empty_field headers before interpreting values. An explicit numeric zero is a recorded value. Preserve absent and zero separately when importing or aggregating. JSON Lines has one JSON object per line. Zeek’s native TSV has header metadata and tab-separated columns.
3. Work through a normal observation
At 02:00:02 UTC, flow C03 from edge-a.capture-01 was recorded as TCP SF with ShADadFf in our synthetic data. Payload totals were 100 and 250 bytes, while IP totals were 340 and 450 bytes. TCP establishment and closure were observed and data appeared in both directions. The higher IP totals cover different bytes, including protocol headers.
The HTTP record with the same source and UID reports 503. The TCP exchange completed normally and HTTP reported service unavailable. Next check the application or proxy and the request timestamp. A deliberately injected 200 under the same UID at edge-b.capture-02 belongs to another dataset. A time-and-tuple match across products is a separate correlation task. Keep the join scope and uncertainty in the case notes.
Flow C04 shows UDP SF with Dd. At the same source and UID, it has two DNS transactions, an A and an AAAA query. Both have NOERROR. The answer arrays contain 203.0.113.44 and 2001:db8::44 respectively. Read the result code and the answer separately. A NOERROR response can also have no address answers. Look for later connection evidence before claiming the client used either address.
4. Investigate signals and choose a response
Repeated S0 across destinations or ports can warrant a review of connection discovery. Asset inventory jobs and monitoring can produce similar patterns. A shared outage or a missing return path can also produce many S0 rows. A connection that used a valid interface or returned data can still represent unwanted activity. Make the claim at the layer with supporting evidence.
- Preserve coverage. Record time window in UTC, capture and collector IDs, Zeek version and scripts, mirror position, and observed loss or clock offset. Retain the raw row and query filters. Look for collection gaps, drops, ingestion delay, and recent routing changes.
- Set a comparison. Group TCP states by source, destination service, and a consistent interval. Track counts and proportions with the flow volume and compare with the same roles and time of day. Preserve source identity and compare across sensors only after accounting for NAT, time skew, and repeated ingestion.
- Test competing explanations. If many hosts abruptly show
S0to one service, check outage, filtering and sensor coverage. If one host contacts many unrelated destinations, check its authorized workload schedule and use endpoint process-to-socket evidence and firewall decisions to test whether the fan-out was expected. - Follow the transaction. Join matching
dns.logorhttp.logusing source provenance and UID, retaining all rows. A missing match can reflect encryption, missing recognition, logging policy, or collection failure. Check the appropriate server or proxy log when the sensor lacks application visibility. Review the capture visibility guide for separate network and capture loss checks. - Respond proportionately. Ask the service owner for evidence when there is a service-wide failure. Escalate potential unauthorized activity when independent signals agree. Preserve packet segments required by policy and report the affected host, window, observed behavior, remaining uncertainty, and the evidence to collect next.
5. Authorized exercise with synthetic records
Download the training records and Python review script. Save both in the same directory. The exercise uses fixed synthetic data, needs Python 3 and runs offline. It does not generate traffic or contact any server. The source and stream keys are exercise metadata wrapped around selected Zeek-style fields. Use authorization and your organization’s collection procedures if you later work with real logs.
- Open the JSONL in a text editor. Read only
connrecords first. For each, write its state and one observation supported by its history or counters. - Find the matching HTTP or DNS entries by
(source, uid). Keep both DNS entries forC04. Explain why the other HTTP record forC03falls outside the join. - Run the script from the directory containing both files.
python3 zeek-conn-review.py
| Case | Expected result and next question |
|---|---|
C01 |
SYN with no reply observed. Did the responder receive it, and was the return path visible? |
C02 |
SYN and responder reset. Which device sent the reset? |
C03 |
Normal TCP lifecycle, 100/250 payload, and HTTP 503. Was the error generated by the application or a proxy? |
C04 |
UDP in both directions, two DNS transactions with NOERROR. What answers did the resolver return? |
C05 |
Midstream observation, payload fields absent in the fixture and zero recorded gap bytes. Where did capture begin? |
C06 |
TCP establishment with a responder-side gap and missing payload fields. Did the sensor or the network lose visibility of bytes? |
C07 |
Normal TCP lifecycle with explicit 0/0 payload. Which observed control packets still count toward IP bytes? |
The expected final line is 7 synthetic flows checked. If Python cannot find the data, check both filenames and confirm the files share a directory. If JSON parsing fails, confirm the downloaded data is JSONL and the browser did not save an HTML page. If your manual join returns 200 with 503, add source to the join key. If it returns only one DNS row, remove any one-row-per-UID assumption.
Verification scope. The Python exercise was executed on the bundled synthetic data. Native Zeek field behavior was checked against the 9.0.1 documentation. Product execution and real packet observations are outside this exercise.
6. Check your reasoning
- A week of
S0appears after a mirror change. Is this evidence of blocking? It supports attempts without observed replies. Verify the reverse direction at the mirror and at the service before attributing the pattern to filtering. - One flow has
SFand HTTP503. Which layer failed? In the fixture TCP established and closed normally. HTTP reported a service failure. Use server or proxy evidence to locate its cause. - Two DNS rows share a UID. Should one be dropped? Keep both when both are genuine transactions within the same source. Compare timestamps, query names, types and transaction identifiers before deduplicating.
- Why save
C07as numeric zero but keepC06unset? Explicit zero is present. The other case supplies no payload count and has positive gap evidence. Converting both to zero skews volume analysis.
Completion criteria. Explain all seven cases, recover the HTTP status and both DNS transactions with a source-scoped join, and write one observation, one plausible alternative, and one confirming data source for a flow with incomplete coverage.
7. Official references and next steps
Reviewed 2026-11-21. The interpretation and fields use Zeek 9.0.1, the LTS release listed on 2026-10-26. Match documentation to the version deployed on your sensor.
Conn::Infofor field types, direction markers, states, and counters. Zeek 9.0.1 connection schema- Native connection and DNS examples, including shared UIDs. Connection log · DNS log
- TSV headers and JSON output options. Reading Zeek logs · ASCII and JSON writer options
- Zeek release dates and LTS branches. Zeek downloads
Previous · TCP Connections and Packet Evidence
Next · Correlate Zeek and Suricata with Community ID
Related articles
Packet Capture Gaps · Did the Network Drop It or Did the Sensor Miss It?
Use paired TCP captures, acknowledgments and sensor counters to tell a coverage gap from possible network loss.
Certificate Transparency · Verify Log Evidence and Investigate Unexpected Issuance
Distinguish a certificate log entry from an SCT, a proof of inclusion and a certificate served by an HTTPS endpoint.