Blue Team · Beginner
Detection Validation · From Event Generation to Alert Delivery
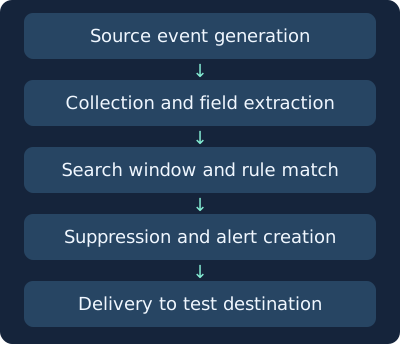
Test source, indexing, rule execution and delivery with positive and negative controls and nine offline cases.
Updated 2026-11-20
On this page
Learning goal. Diagnose “no alert arrived” by checking event generation, collection, rule execution and delivery. Define the expected result for an authorized test before running it, then retain evidence from each stage.
1. Start with a detection hypothesis
A rule compares observations with a condition. For example, a rule can send a test alert when a particular training marker appears in a test index. For production analytics, describe the behavior, required sources and fields, time window, exclusions and expected analyst action. A single address or User-Agent is a lead. Attribution and impact need supporting evidence.
Example hypothesis. If the approved host writes a marker and the event reaches the search pipeline in time, the test rule matches once and its result reaches the test destination. The claim applies to the specified input, fields, time window and destination.
2. Evidence to keep at each stage
| Stage | First question | Evidence |
|---|---|---|
| Generation | Did the host or sensor write an event? | Raw record, source time, host and event ID |
| Collection and indexing | Did it reach the searchable location? | Collector, index and arrival time |
| Field extraction | Did the rule’s field populate? | Raw and parsed fields, mapping version |
| Rule execution | Was the event in the run’s search window? | Search job, window and match result |
| Alert creation | Did a match produce an alert? | Alert ID, suppression and deduplication |
| Delivery and handling | Did it reach the intended destination? | Action status and test receipt |
An event stamped minute 8 and indexed at minute 11 was not present during the minute-10 run. A minute-15 search that only covers event minutes 10–15 can miss it again. Compare the event window with measured arrival delays. Overlapping windows can reprocess the same event, so test your deduplication. Scheduling, reruns and suppression depend on the platform and configuration.
3. Use positive, negative and failure controls
| Control | Synthetic input | Expected result |
|---|---|---|
| Positive | Training marker, correct fields and time | Rule match and delivery to test destination |
| Negative | Routine marker through the same path and window | Source and indexing confirmed, no rule match |
| Time boundary | Start/end timestamps or delayed arrivals | Inclusion or exclusion follows the documented window |
| Failure | Missing source, field or delivery stage | Identify and fix the first broken stage |
| Duplicate or suppression | Repeated matches under a configured rule | Match and delivery counts follow policy |
A negative control means something when the original record exists and indexing succeeds. Otherwise, the test cannot establish that the rule excluded ordinary activity. One positive result covers the conditions exercised. Record the platform, version and tested scope.
ATT&CK can organize the behavior and detection strategy. Verify the actual sensor, fields and analytic conditions before making a coverage claim. Sigma uses logsource and detection to describe source and matching logic. Check normalized fields, case and condition semantics after conversion for your backend.
4. Reproduce a missing alert starting at the source
- Record the approved test ID, time range, expected result, rule version and parsing version.
- Locate the source record by ID. If absent, review the generation and audit configuration.
- If generated, check collector arrival and the assigned index, source and event time.
- Compare the indexed raw event with the extracted fields. Check whether an event visible now was indexed when the scheduled search ran.
- If the rule matched, check suppression and notification action status. Confirm receipt at the test destination.
- Record the change and evidence. Rerun positive and negative controls. Review false alarms and missed detections before broadening a rule or adding exclusions.
On an approved Linux test host, the following util-linux logger example emits one harmless marker to the local logging path. Collection and extraction need a configured pipeline. Use a test destination if the system has existing alert actions.
logger -t wiki-test -- 'wiki-canary validation_id=LAB-01'
First confirm that the raw message contains LAB-01. Then check whether the parser extracts the training marker into the field required by the test. The offline analyzer below makes no calls to logger or a SIEM.
5. Offline exercise · Nine synthetic cases
detection-validation.json · detection-validation.py
Save both files together and run Python 3. Times are minutes from a fictional start. One run at minute 10 searches event times from minute 5 inclusive to minute 10 exclusive. Here suppressed means a match was suppressed. Notification records receipt at the test destination.
python3 detection-validation.py
| Cases | Expected observation |
|---|---|
| lab-01 / lab-02 | Positive delivered, routine negative did not match |
| lab-03 / lab-04 | Source absent, then source present but indexing absent |
| lab-05 | Indexed but required field missing |
| lab-06 / lab-09 | Arrived after execution, then event outside window |
| lab-07 / lab-08 | Suppressed, then matched but delivery missing |
Expect PASS: nine detection pipeline cases. For missing files, check names and paths. For a wrong result, inspect the execution minute, event and index times, required fields and suppression. Publication ran the offline fixture. Test live log generation, indexing and delivery in the actual environment.
6. Check your understanding
- The event is searchable now, but no alert arrived. What do you check? Inspect the scheduled run, whether the event was indexed by then, the window, fields, suppression and action status.
- Does silence mean a negative control passed? Confirm original generation, indexing and the nonmatch.
- Rule matched but delivery failed. Should the condition change? Inspect suppression and notification actions first. When changing conditions, rerun positive, negative and duplicate controls.
Choose three cases and record the earliest failing stage and its evidence for each. To validate in an actual environment, trace one test ID from generation to receipt and record the tested versions and scope.
Previous · Incident timelines · Related · Splunk investigations
Official references
Reviewed 20 November 2026. Verify dashboards and scheduled searches against the installed version and configuration.
- NIST SP 800-61 Rev. 3 · Incident response, April 2025
- MITRE ATT&CK · Detection Strategies
- Sigma Rules Specification · logsource and detection
- Splunk Enterprise 9.1 · Alert scheduling, updated July 2025
- util-linux · logger(1)
Verify Windows Event Forwarding Delivery
Distinguish source, subscription, collector and SIEM gaps
Validate Kubernetes API Audit Evidence
Distinguish authorization, server-side previews and completed writes in the audit stream
Validate a Windows Code Integrity Signal
Compare source and forwarded App Control events by activity ID.
Related articles
Windows App Control · Read Audit, Block and Signature Events
Connect Windows Code Integrity policy decisions, signature records and policy activation evidence without mistaking a block for malware execution.
Blue Team Fundamentals: Detection to Response
An introduction to security monitoring, triage, investigation, incident response, and detection improvement.