DFIR · Beginner
Linux Journal Coverage · Compare Local and Central Evidence
Trace a systemd journal record from service to analyst, identify missing boots and delivery gaps, and run eight offline controls.
Updated 2026-11-21
On this page
Learning goal. Explain what a missing journal row can mean. Compare a local and a central copy, and determine which collection stage needs more evidence. This chapter covers hosts using systemd-journald. Other Linux logging paths may need separate checks.
1. Follow the record through the pipeline
A unit is a systemd-managed resource, such as a service. journald accepts messages from inputs such as the kernel, syslog, the native journal API and service standard output or error. The structured journal attaches metadata to messages and stores entries according to policy. journalctl reads journal files. A central shipper and an indexer may apply more filters, transform fields and retry deliveries.
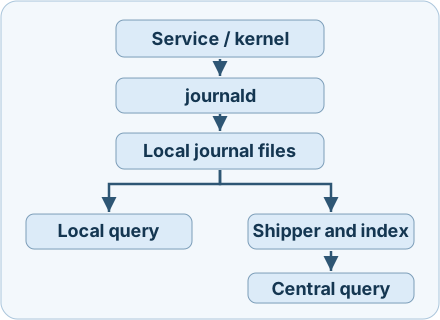
The diagram covers shippers that read the local journal. Direct syslog forwarding and other routes can have different collection boundaries. A journal namespace is a separate stream and store on a host. An application configured to log into a named namespace may be absent from the default view. A Linux container with a separate log driver is another possible collection path.
| Evidence | How to use it | Limit |
|---|---|---|
_MACHINE_ID, _BOOT_ID |
Group by origin and boot. Verify the host against asset inventory | A hostname can be reused and a cloned image can duplicate a machine ID |
_SYSTEMD_UNIT, _PID |
Identify the service context where the fields are available | PIDs are reused. Inherited stdout/stderr can carry the credentials of the process that opened the stream |
SYSLOG_IDENTIFIER, MESSAGE |
Find application messages and read their context | Client-supplied values can be misleading |
__CURSOR |
Identify an entry position in the journal export, when preserved | Treat it as opaque. A collector may drop or replace it |
__REALTIME_TIMESTAMP, __MONOTONIC_TIMESTAMP |
Compare wall time with the journal’s within-boot ordering | Both describe journal receipt, not the application’s internal event time. Monotonic values reset across boots |
Fields with one leading underscore are added by the local journal for native collection. Double-underscore address fields appear in serialised exports. Evaluate trust in the original host and export path. A downstream JSON document can contain similarly named fields without having the same provenance.
2. A normal check, and a clock that steps back
Suppose reports.service sends a health message. The local export records the machine, boot and an opaque cursor. The central shipper retains the origin namespace and fields. A matching cursor and payload on the same origin and boot support successful collection of that particular entry. A second copy after a retry still represents one original record. Preserve both observations and count a verified duplicate once when building a timeline.
Two messages on the same host, namespace and boot show these values. The numbers below are simplified from the synthetic exercise.
| Entry | UTC wall time | Monotonic elapsed time | What you can conclude |
|---|---|---|---|
| LAB-01 | 00:00:10 | 100 s | The journal received this entry first |
| LAB-02 | 00:00:06 | 102 s | The journal received it two monotonic seconds later, while wall time moved backward |
The exported times use microseconds. Use monotonic time to compare receipt order inside one boot, and record the clock discontinuity. A 100-second value from another boot or host belongs to another time domain. Do not splice it into this order. A central ingestion timestamp is a third observation that may include buffering, transformation or queue delay.
3. Explain missing boots before attributing tampering
On systemd 257, Storage=volatile writes to /run/log/journal. Data stored only there ordinarily does not survive reboot. Storage=persistent prefers /var/log/journal, with a runtime fallback when disk storage is unavailable or during early boot. Storage=auto follows whether the persistent directory exists for the default namespace. Inspect effective configuration and drop-ins, including namespace-specific settings. Disk limits and retention affect which files remain. Service rate limiting can drop messages and report suppression. An app can also be silent or write to another destination.
A privileged actor could interfere with collection or alter local evidence. Examine verified changes to service and logging configuration, known maintenance, disk pressure and central copies. Prior boots visible centrally but absent locally can also follow normal retention or volatile storage. Missing central rows alongside retained local rows narrow the investigation toward the delivery or query path, provided both views cover the same namespace and time range. Neither observation alone identifies who caused the gap.
4. Collect and validate each stage
- Set the investigation boundary. Record the source host, boot IDs, namespace, unit, desired query interval in UTC and log access context. Inspect local and central time coverage separately. The first and last entries in
--list-bootsdescribe available messages. They are not exact power-on and power-off times or a list of every historical boot. -
Preserve and query a working copy. Preserve original journal files and hashes using your evidence procedure, plus collector exports and system identity records. Use an approved account with read access. Query a restricted copy, because journal fields and message bodies can hold secrets. The example uses a directory containing copied journal files and a boot ID from the first command. Replace the example paths and ID with authorised values.
journal_copy='/path/to/copied-journal-files'
boot_id='bbbbbbbbbbbbbbbbbbbbbbbbbbbbbbbb'
journalctl --directory="$journal_copy" --utc --list-boots --no-pager
journalctl --directory="$journal_copy" --utc -o json --all --no-pager \
  "_BOOT_ID=$boot_id" "_SYSTEMD_UNIT=reports.service"
The exact field filter selects messages with that unit metadata. Manager messages about the unit may be recorded under different fields. Inspect broader scoped results or the documented
-umatching behaviour when needed. Portable JSON may represent repeated fields and non-text bytes as arrays. In systemd 257, ordinary JSON can emitnullfor values larger than 4,096 bytes, while--allallows larger output. Keep the original in addition to the projection. - Check integrity and delivery independently.
journalctl --verifycan check internal file consistency on a copy. Authenticity verification with Forward Secure Sealing requires a sealed file and the corresponding verification key. Neither check establishes complete historical coverage. Compare host and namespace mappings, shipper health and saved position, queue/retry logs, parsing failures, indexing latency, retention and search permissions. Investigate conflicts with original records before deduplication. - Verify the repair. On an authorised test host, write one harmless marker without sensitive data using
printf '%s\n' 'wiki-journal-check-01' | systemd-cat -t wiki-journal-check. Search the same host and intended namespace withjournalctl --since '5 minutes ago' -t wiki-journal-check --no-pagerand look for the same marker centrally after the normal delivery window. The tag is a client-supplied identifier. Correlate time and origin. This validates the test route only. To check a production unit’s route, use an approved test generated through that unit’s configured logging path.
5. Offline exercise · Compare eight cases
Get the case file and Python reviewer, save them in one folder, and run python3 journal-coverage-review.py. Use Python 3.8 or later with the standard library. The file contains simulated local and central exports and separate namespace labels. Its cursor strings are training values. The script reads only this file, compares exact fixture fields and never reads host logs.
| Cases | Expected result |
|---|---|
| LAB-01 and LAB-02 | Both paired. The report notes that wall time moves backward within a boot |
| LAB-03 and LAB-04 | Local-only on the current boot. Central-only on an earlier boot |
| LAB-05 and LAB-06 | Same source key but conflicting message. A separate central row lacks a cursor |
| LAB-07 and LAB-08 | Identical delivery duplicate. Two separately scoped rows despite a shared cursor label |
Expect nine comparison rows and one clock finding. If results differ, confirm the filenames, then inspect the machine ID, boot ID, namespace and cursor. The fixture assumes the central tool preserves these fields. In production, missing metadata calls for independent corroboration. Do not infer an exact match from timestamp and message alone.
The synthetic exercise ran in the cloud. journalctl --list-boots was also checked against an empty input directory with systemd 257.13 to confirm its no-record behaviour. Live message emission, forwarding and storage were reviewed in the manuals.
6. Check your understanding
- A previous boot is absent locally. What do you know? It is absent from the readable files in scope. Check storage, retention and central copies.
- The local and central rows share a cursor but differ in message. Which one wins? Preserve both. Check the source journal, origin and conversion rules before choosing a version.
- Can you compare monotonic values across boots? They are scoped to each boot. Cross-boot ordering needs wall-clock or external time evidence.
- Does a new marker found centrally establish historical delivery? It confirms delivery for that tested message, time and route.
Completion. Name the next evidence to collect for LAB-03 and LAB-04. Explain the clock change and why LAB-08 yields two results.
Previous · Linux authentication evidence · Related · Linux process evidence
Official references
Reviewed 21 November 2026 against systemd 257.13 manuals. Distribution defaults, namespaces and shipper implementations vary.
- systemd · journalctl 257, output, boot selection and verification
- systemd · Journal fields and metadata
- systemd · journald 257 inputs and namespaces · Storage and rate limits
- systemd · systemd-cat 257 · Example native shipper, systemd-journal-upload
Investigate Linux systemd timers
Investigate Linux systemd timers. Separate timer configuration, individual service runs, and application results.
Related articles
Backup Restore Verification · From Saved Copy to Recoverable Service
Use a real offline SQLite restore exercise to distinguish a matching hash, a usable database, an acceptable recovery point, and a service ready to resume.
Velociraptor Endpoint Collection: From a Network Alert to Host Evidence
Scope a request to one endpoint and interpret collection coverage, zero results, missing files and SIEM delivery using nine fictional cases.